Victòria Oliveres Torrescassana
Journalist specialist in data analysis and visualization, interactivity and video.
I studied the Degree in Journalism at Pompeu Fabra University (Barcelona) and the Master in Data Journalism at Birmingham City University (United Kingdom).
vicoliveres@gmail.com
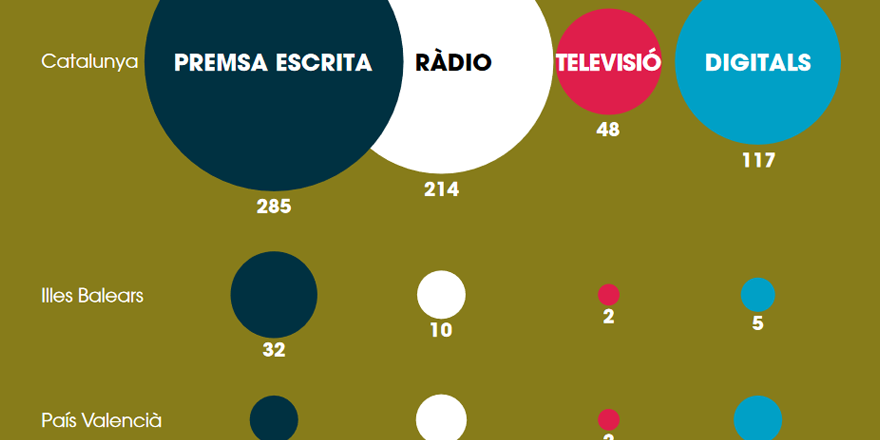
Infographics for the yearbook of media silences
February 2020 - Mèdia.cat
Design of four static infographics for Mèdia.cat's 2019 Yearbook. Journalists injured in mobilizations, Catalan language in the media, institutional advertising and a news self-factchecker are the topics.
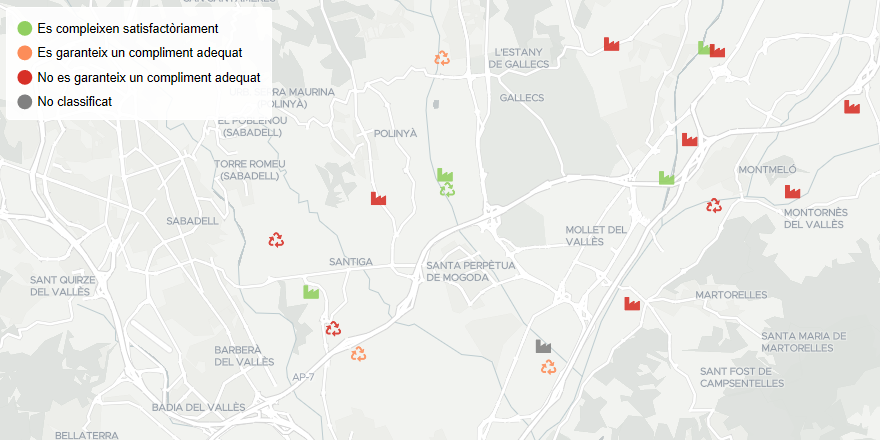
Environmental inspections of companies in Catalonia
December 2019 - Catalunya Plural
Analysis of the infractions detected by the Department of Territory and Sustainability during environmental inspections in 2018. Data scraped from each result PDF document.
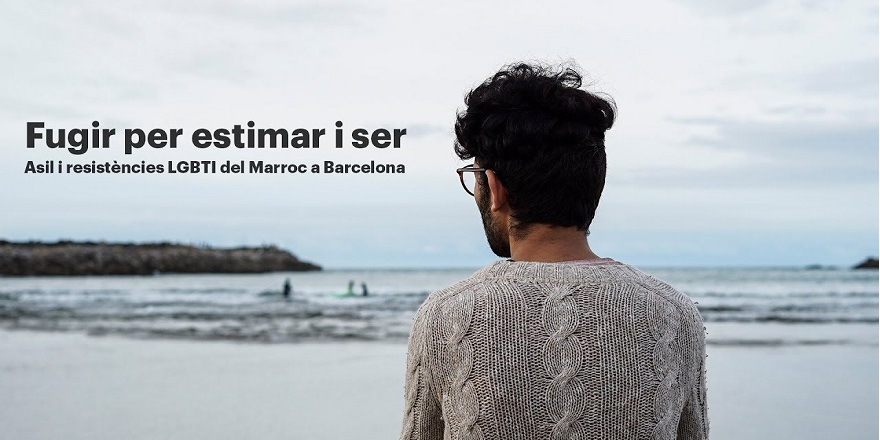
Documentary: Escaping to love and to be
May 2019 - la Directa
A documentary that shows the persecution of LGBTI people in Morocco, their resistance and the processes of exile and asylum in Barcelona. Co-directed with Sònia Calvó and Víctor Yustres.
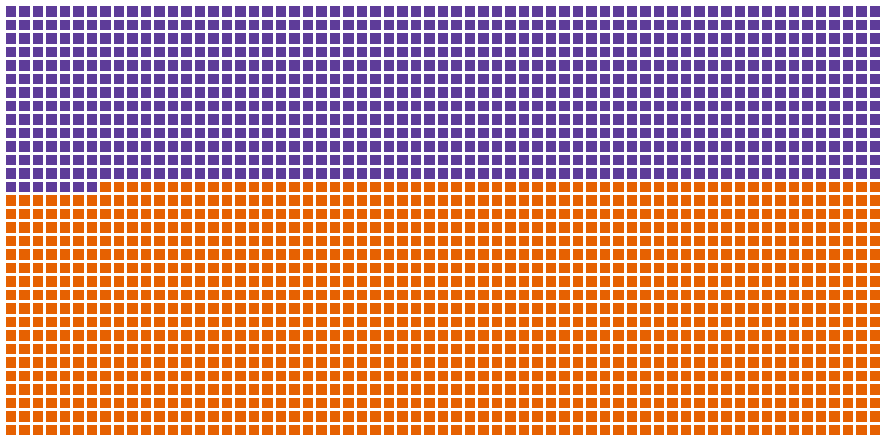
Candidacies leaders gender gap
May 2019 - Catalunya Plural
Visualization of the unequal number of men and women who led the candidacies in the municipal elections. Analysis made after scraping PDF documents rom each zone electoral board.
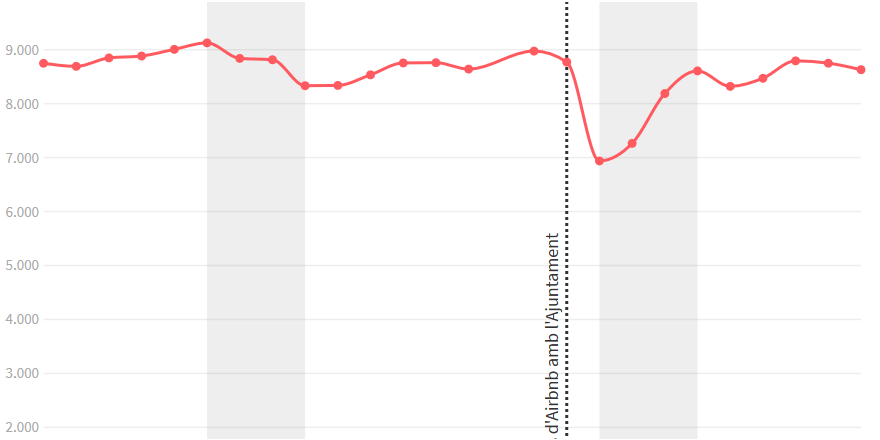
The evolution of Airbnb's offer in Barcelona
March 2019 - Catalunya Plural
With the analysis of the data provided by Inside Airbnb, we checked whether Airbnb's commitment to Barcelona City Council to remove advertisements for illegal tourist flats was fulfilled.
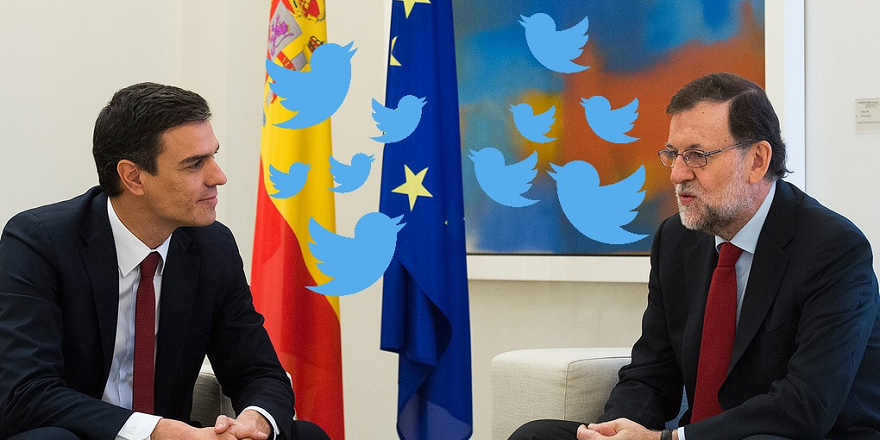
By their tweets you will know them
February 2019 - Catalunya Plural
Pedro Sánchez and Mariano Rajoy congratulated athletes, artists and politicians; men, women and groups via Twitter. We visualize the tweets and compare them in an interactive infographic.
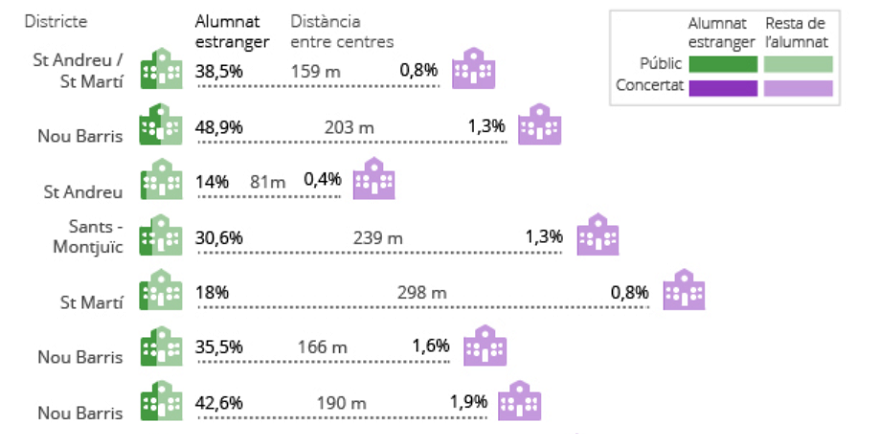
Immigrant students in Barcelona's schools
January 2019 - Diari Educació
In the Catalan capital, 17 primary schools have less than 1% immigrant students, while 18 others have more than 50% of these students. We analyse the data obtained through a Transparency request.
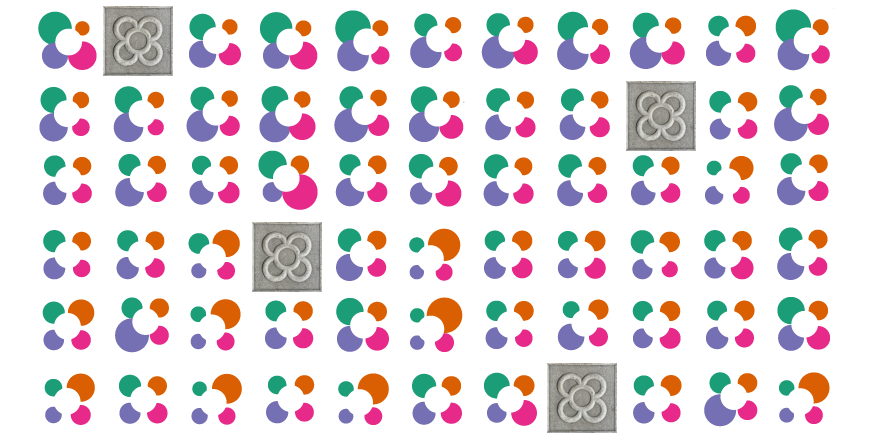
Many cities in one: a portrait of inequality in Barcelona
November 2018 - Revista XQ
The richest neighbourhood of Barcelona, Pedralbes, has an income seven times higher than the poorest, Ciutat Meridiana. Between this two, 73 neighbourhoods. We present the data in an interactive infographic.
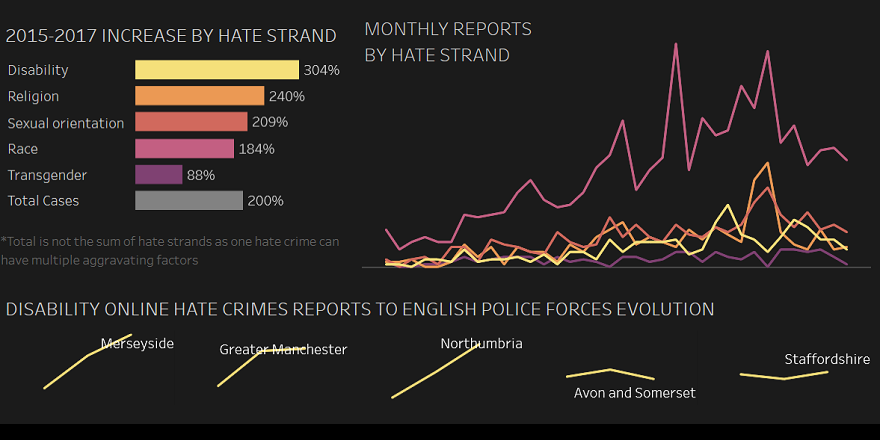
Tackling online disability hate in the UK
Maiyg 2018 - Master's assignment
Based on 26 police responses to FOI requests, we look at the growth of hate crimes and incidents against people with disabilities in the UK using different social media.
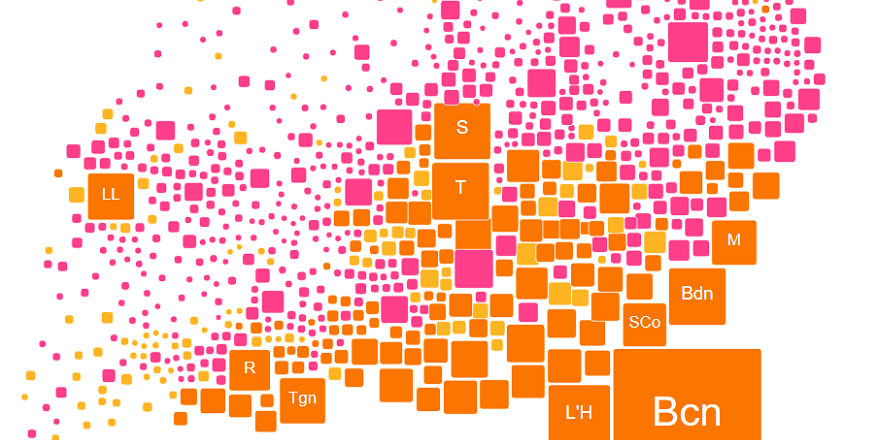
Mapping the catalan vote with cartograms
January 2018 - Master's assignment
Visual analysis of the results of the Catalan Parliament elections. Using cartograms of counties and municipalities, we visualize each party result and the changes between pro-independence and unionist forces.